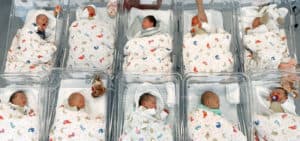
We are similar. Human beings share a basic genetic heritage. We start with the same features—head, eyes, ears, arms, legs, internal organs, and so on. Like the ten babies in Figure 4.1, we also start with the same fundamental behaviors–we sleep, eat, cry, and squirm.
The human body has a regular layout of nerves, which connect to the brain, and back from the brain to the muscles. We all see, hear, taste, smell, and feel.
Sensory Nerve Paths
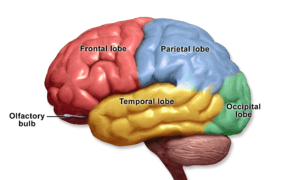
The first thing to know about the brain is that not all of its 100 billion neurons are available to any task. It’s not like computer memory, all available for any task you assign it. There are built-in paths that the separate senses must travel. Each lobe of the cortex—the outer, most recently developed part of the brain—is neurologically connected to a different sensory mode. In this side view (Figure 4.2) of a typical brain, the outer lobes of the cortex are color-coded and labeled.
- The temporal lobe, yellow and behind the temples, receives the acoustic data from the ears.
- The occipital lobe, green and at the rear of the brain, receives visual data.
- The parietal lobe, blue and atop our head, abutting the front lobe, receives bodily sensations via the spinal cord.
- The frontal lobe, red and behind the forehead, receives information from the other lobes that it uses to form our responses, controlling our muscles and behaviors.
Almost all sensory data arrives at the thalamus, a midbrain traffic cop for sensory data and movement. Underneath the cortical lobes also lies the limbic system, a set of neural structures that handle data and are concerned with primitive needs and fears. There will be discussion of the limbic system in the sections on brain through the ages and sources of thinking.
In addition to our different keyhole views of the world, our genetic makeup gives us a unique neural threshold based on which to categorize, to develop likes and dislikes, and thus form our own particular mental worldview.
Unique Features
The sensitivity of our senses is supplied by our genetic inheritance. Although there is a broad commonality across humanity with sensory organs that allows us to guess at another’s view of physical reality, we do not have identical sensory sensitivity. The revelation and investigations of John Dalton (1800s) that he was color-blind is a striking example of a genetic difference. Many differences are more subtle, but still important.
Handedness and Language Hemisphere
There is a strong, but not absolute, tendency for the cortical hemisphere that generates language to also control one’s dominant hand. Our genes lead most of us to handle language in the left hemisphere along with control of our right hand (the cross-over of nerves from each body side occurs prior to the cortical hemisphere. Thus internal monologue, generating speech, and listening to others occur in the same hemisphere as the cortical neurons which control movement and speech.
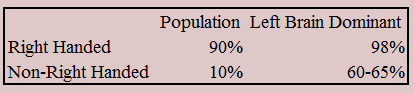
In Figure 4.3, using data from the Encyclopedia of the Human Brain (p. 364), we see that 90% of the population is right handed. They use the right hand to write, throw a ball, reach for a glass of water, and so on. The last column shows that 98% of the 90% of the population who are right handed are left brain dominant. In this case, 88% of the population uses the left hemisphere for both primary speech and primary movement.
The second row pertains to non-right handed people, both left handed and ambidextrous individuals. They form the other 10% of the population. Note that more than 60% of non-right handed people are also left brain dominant. They use their left hemisphere to speak and understand words, but their right hemisphere (the nondominant hemisphere) to control their primary physical responses. For these individuals, 6% of the population, the coordination of their verbal thoughts and their planned movements must be accomplished across the hemispheres, mediated by the corpus callosum.
Nondominant Hemisphere
Cognitive scientists have discovered that the nondominant hemisphere (the right in most cases) does add meaning that we use in conversation. It adds metaphorical interpretations to the words. That is, the dominant hemisphere uses literal meanings of words, while the nondominant hemisphere finds associated meanings to the ideas which share a similarity.
Here’s a question. What processing occurs in the right hemisphere when the left hemisphere is busy with controlling primary bodily movement and language? In general, what is the nondominant hemisphere doing while the dominant hemisphere is handling words?
Why is hemispheric dominance not consistent across the population? Because many genes contribute to hemispheric dominance. Obviously, genes are not identically distributed among people.
Interpretation
Here is another case demonstrating that, although we have genetic differences, we process information in essentially the same way.
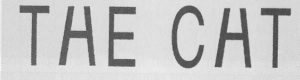
Take another look at Figure 4.4. Do you see two words? THE and CAT.
Yet, something looks a bit strange. Why? The H in THE and the A in CAT are exactly the same image.
Yet, you read the first form as H in THE and the second form as A in HAT. How is that possible?
This is an excellent example of an inductive interpretation. The H is highly likely between T and E, while A is more likely between C and T. When your knowledge of words is combined with what your eyes see, your brain comes up with the best interpretation of the same image in different contexts. The visual input is abstracted and merges your knowledge of words uses the closest match (by induction) to decide on the word. Also, you might have noticed that you recognized the words before your conscious brain was involved in the identification. This was not a logical deduction.
A few people may balk at the assignment of the middle letters to different categories. Their neural threshold, determining the amount of exactness needed for them to accept a match, occurs at an extreme of the human neural threshold range of 78-85 mV (milliVolts). Everyone does not need the exact same input from senses and memory for a neuron to fire its axon.
Differences among People
Chest Measurement Distribution
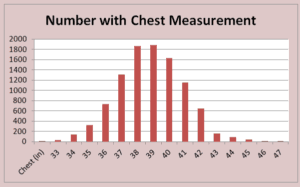
An interesting insight into the variability of genetic heritage can be seen in physical measurements. These chest measurements (Figure 4.5) are sourced from Francis Galton’s classic essay, “Classification of Men according to their Natural Gifts.” I’m not addressing his ideas, just using his data pertaining to the chest measurements of Scottish recruits for the British Army. Plotting the number of men with each particular chest size clearly shows an important characteristic of human endowment of specific physical traits. The average chest measurement, about 39 inches in this chart, also has the maximum occurrence. The higher and lower values trail off in frequency at roughly the same rate.
Form the genetic perspective, an obvious question is why aren’t there two clusters of chest sizes—one that the dominant gene mandates and the other from the recessive gene? That is not the observed situation. Undoubtedly, the environment plays a role in the spread of chest measurements, but it doesn’t explain the existence of the sole peak in the distribution.
One Trait, Many Genes
The reason is chest size is not controlled by a single gene, but rather many genes.
With the simplifying assumption that each gene has independent binary effects, the laws of probability lead us to the normal or Gaussian distribution of a particular trait. The normal distribution is a symmetrical, bell-shaped mathematical function with tails on both sides approaching zero, like Galton’s saw in the recruits chest measurements.
It’s important to remember that despite individual genes having idealized dominant and recessive traits, particular physical qualities are the result of many different genes. Physical measurements, such as weight, height, age at first step, age of puberty, and intelligence, follow a normal distribution, not a two cluster pattern.
The multiple, small contributions of many genes leads to us sharing certain traits, but not to the same magnitude. This occurs in addition to manifestations of trait distributions affected by the environmental experience.
Raw sensory data, which is the basis on which we build our worldview, is processed somewhat differently by each person.
The knowledge you have gained and the certainty you ascribe to it makes a significant difference to your internal worldview.